
📊 Dashboards#
Dashboards visualize values from your product queries in Mergado as interactive charts. You see how the assortment develops over time and the state of your data at a glance.
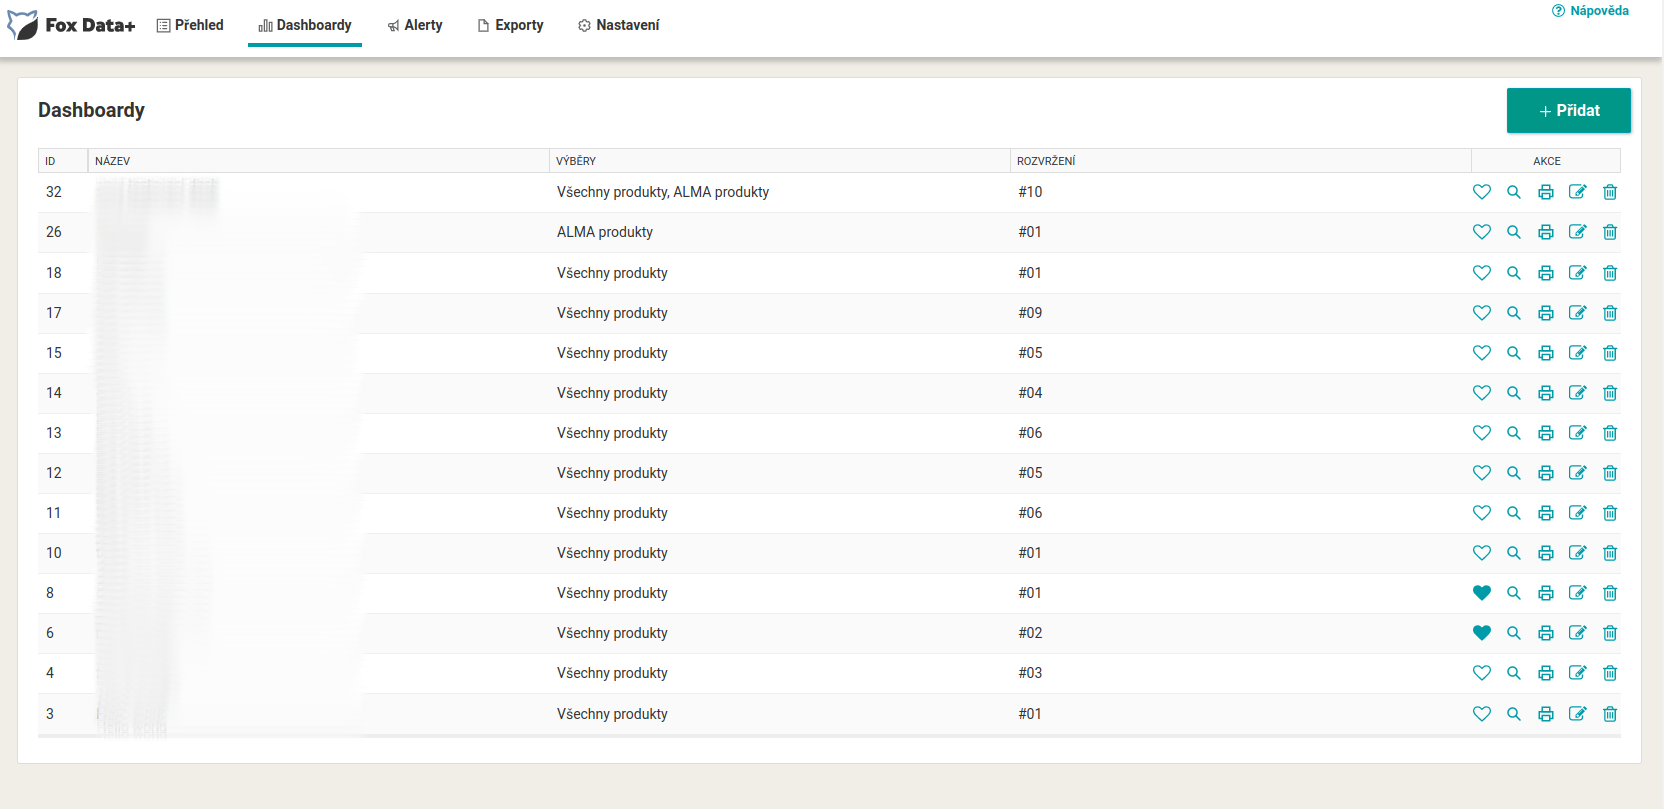
List of dashboards#
The table shows each dashboard’s name, the queries it is built on, and the layout used. Each one has actions: mark as favorite, preview, print, edit, and delete. Create a new one with the Add button.
Creating a dashboard#
When creating one, you enter a name, choose a product query from Mergado, and pick one of the preset layouts (a grid of boxes for charts). The Add to the Overview page option pins the dashboard to the home Overview, and Send by email has it sent to you regularly.
Designer and chart types#
In the designer (dashboard editing) you add a chart to each box. Five types are available:
- Pie, Radial, Line, Bar, and Text (a text value).
For a chart you set the label, the X and Y axis labels, the point size, line smoothing, and whether to show the legend and data labels. In the Data section, use Add source to link a specific element or value from the query, and for statistics choose a history of 7, 14, or 30 days.
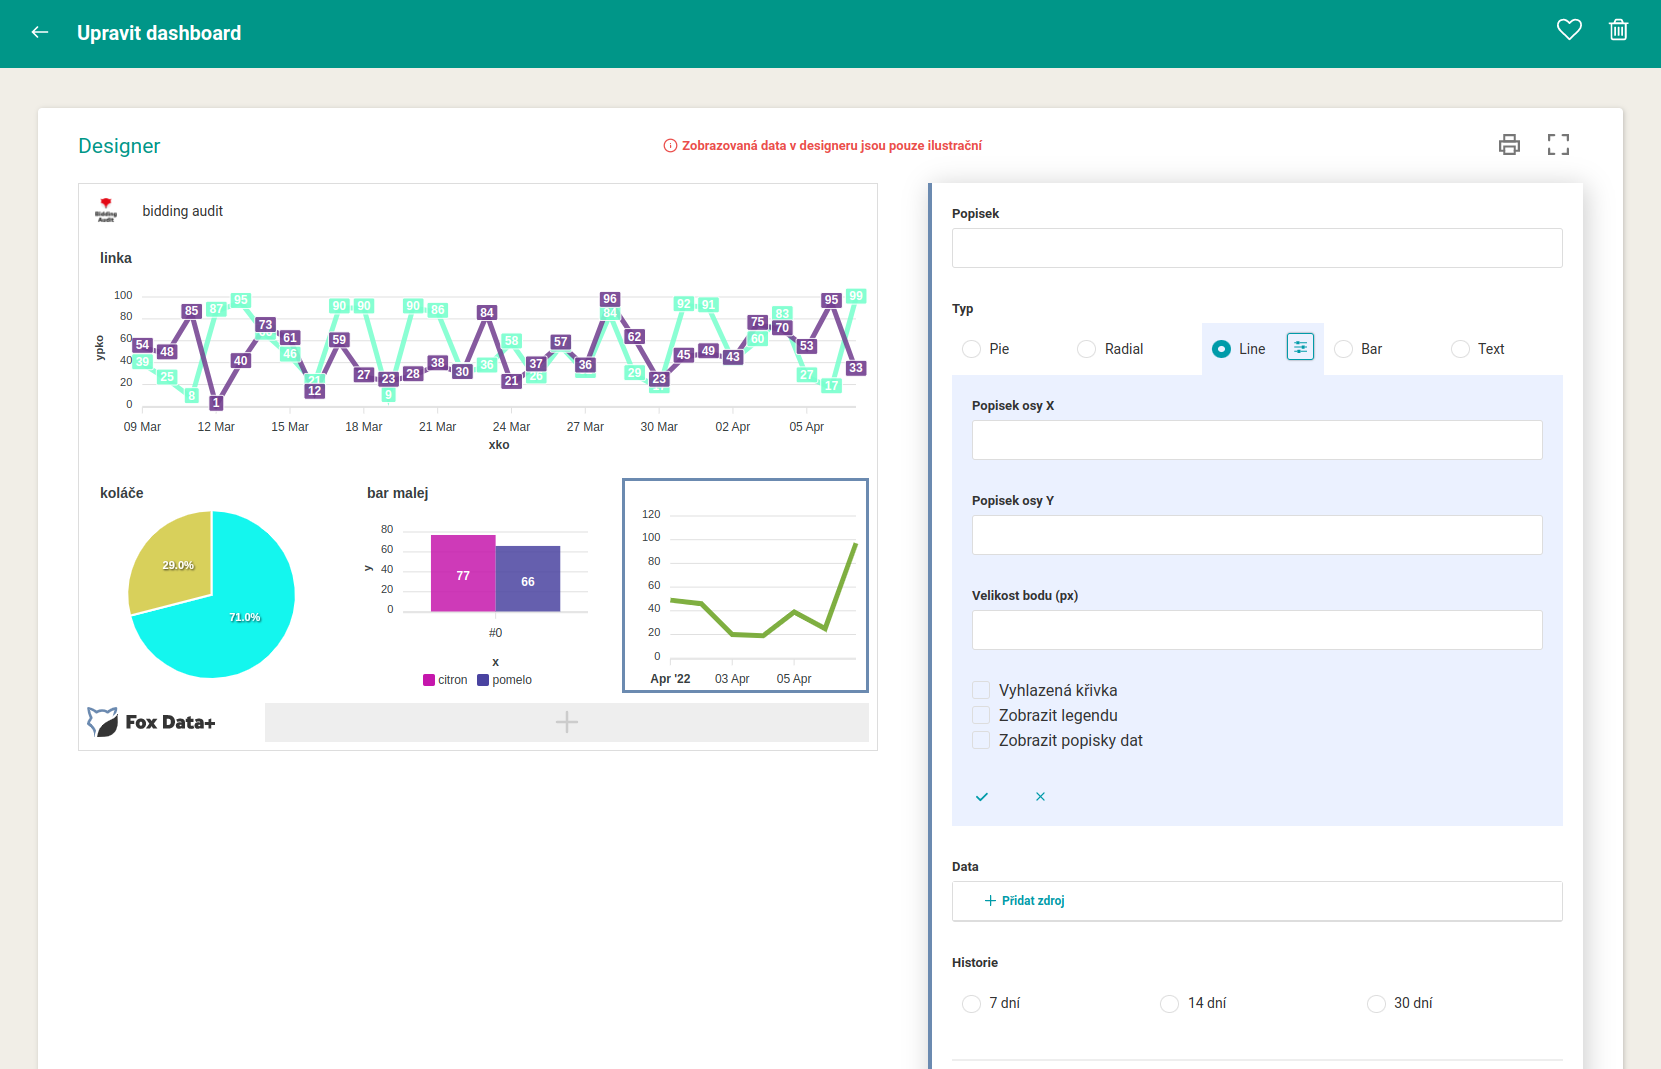
⚠️ The data shown in the designer is illustrative only. The real values appear only in the saved dashboard.
Sharing and export#
A dashboard refreshes every hour. You can print it, export it to PDF, share it with a public link, or have it sent to you regularly by email (every 1, 7, 14, or 30 days).
FAQ#
-
Where does the chart data come from? From elements and queries in Mergado. Statistics from Heureka, Zboží.cz, and Google Analytics are supplied to Mergado by Bidding Fox Elements.
-
How do I get a dashboard onto the home screen? When creating or editing it, tick Add to the Overview page.
-
How often does a dashboard refresh? Every hour.
-
Can I insert an image or a logo into a dashboard? Yes, the steps are in the guide How to insert an image into a Fox Data+ dashboard.