
🏠 Overview#
Overview is the landing page of Bidding Fox. In one place you see how your project is doing in bidding: the current assortment status, performance, occupancy of bid positions and news in the application. In the top right corner you choose the time range (7 days, 14 days, 30 days or a custom period).
Current assortment status#
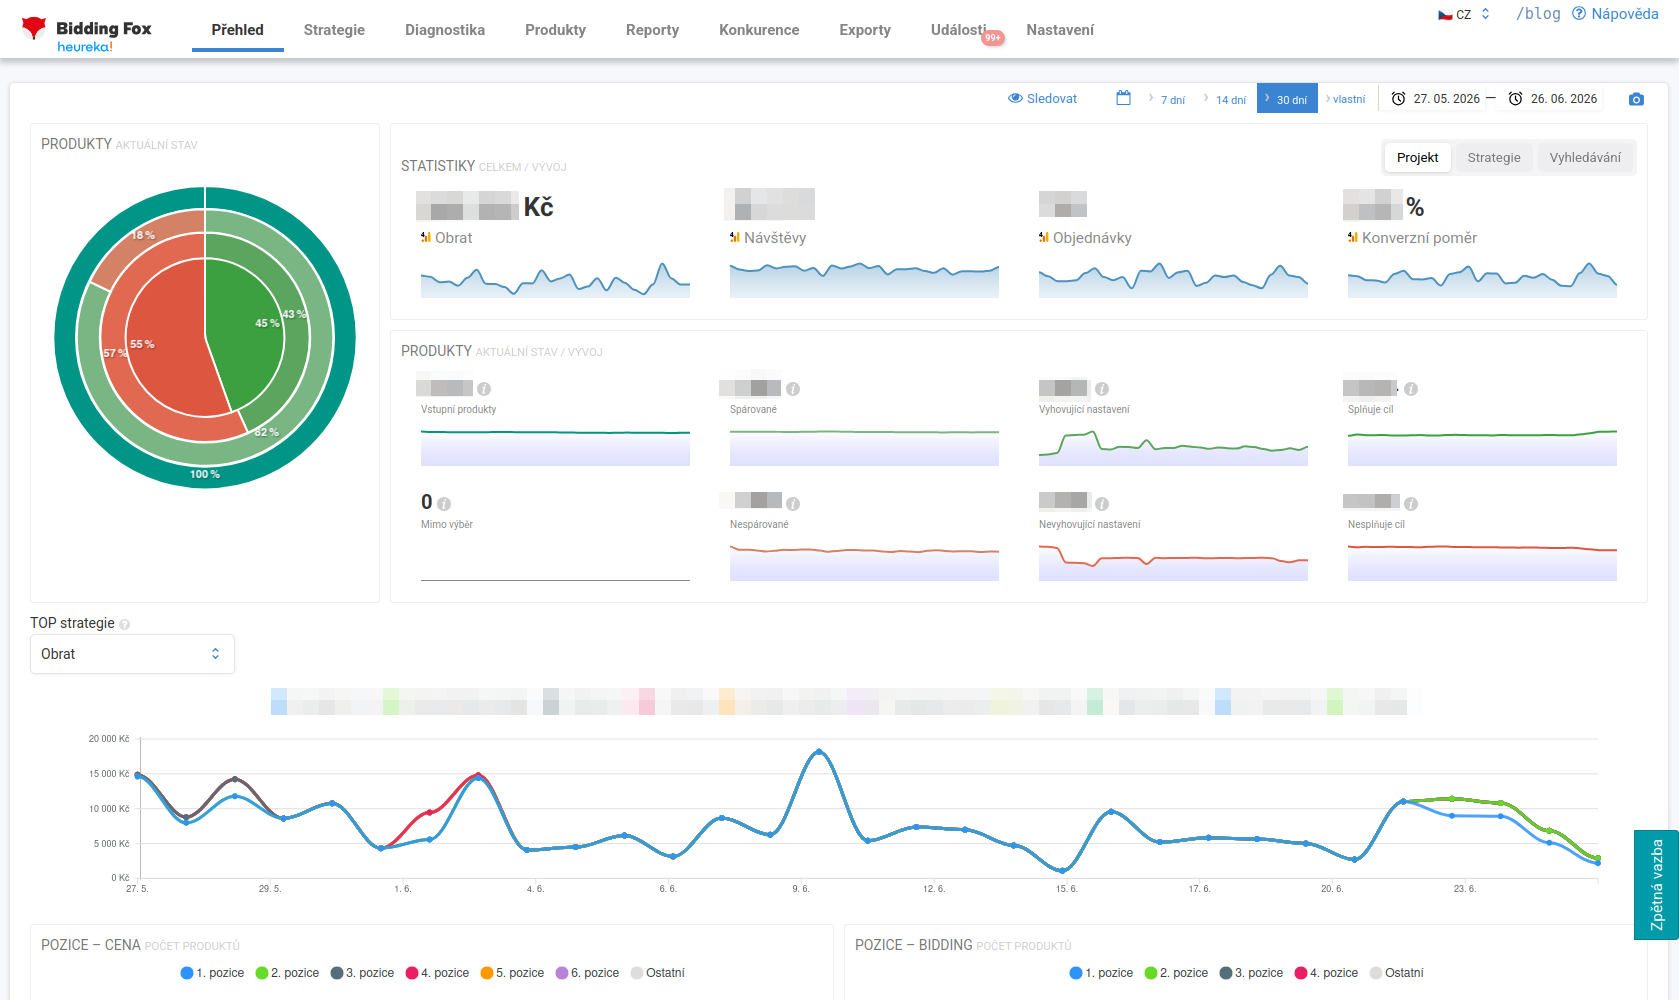
Right at the top you see how many products Bidding Fox is processing and what state they are in. The pie chart and status tiles show mainly:
-
Input products: how many products are coming into Bidding Fox.
-
Matched and Unmatched: only matched products can be bid on, that is, those matched to product cards on Heureka or Zboží.cz where there is something to compare against.
-
Compliant and Non-compliant setting: how many products comply, or do not comply, with the strategy setting.
-
Meets goal and Does not meet goal: how many products are at the target position.
-
Outside query: products that do not fall into any query used in strategies.
When you first turn on Bidding Fox and create your first strategy, you will see the number of matched products as 0. Gradually, as Bidding Fox queries the price-comparison sites via the API, the number of matched products grows and the number of unmatched ones drops. Downloading data for the entire assortment may take a while, but it should be done by the next day at the latest.
💡 Until you have created at least one strategy, Bidding Fox will not start downloading data for each product (statistics, positions on price-comparison sites, matching). That is why the first strategy is key, see Strategies.
Statistics and performance#
The statistics block shows a summary of revenue, visits, orders and conversion rate with a trend chart. Using the switch you choose whether you want to see data for the whole project, for strategies, or for searches. Below you find detailed statistics with switching between clicks, orders, conversion rate and revenue.
How bidding positions develop#
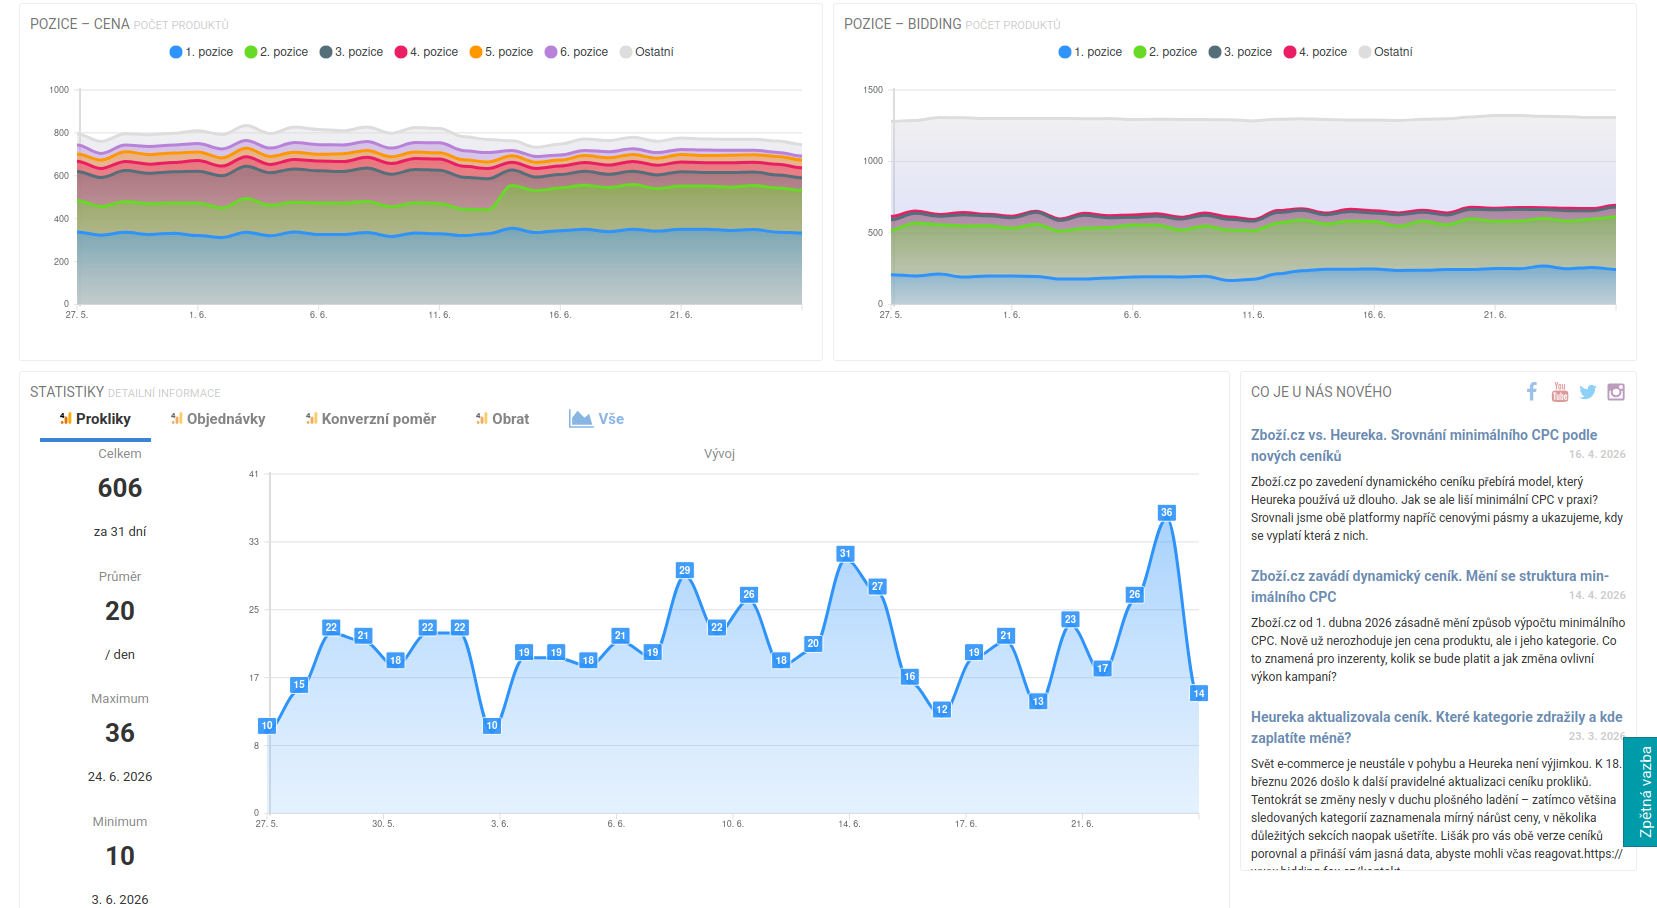
The TOP strategies chart shows which strategies drive performance (for example by revenue). The pair of charts Position by price and Position in bidding then show how many products you have at individual positions (1st to 4th) and how large a part of the assortment even makes it into bidding. A separate chart tracks the development of the number of products over time (input, matched, outside query and so on).
The charts are useful mainly when running Heureka and Zboží.cz at the same time. These usually do not have the same performance, so on one price-comparison site you may occupy more bid positions than on the other. A sudden spike or dip in the chart hints that something changed in the repricing or in the feed.
News in the application#
In the What’s new with us block you find the latest Bidding Fox news and links to fresh articles from the blog (for example changes in the Heureka and Zboží.cz price lists). It comes in handy for a quick overview of what is new in the application and in e-commerce.
FAQ#
-
Why do I see 0 for matched products? Bidding Fox only starts downloading data after you create your first strategy. The full number of matched products is usually reached by the next day.
-
Why do I have different performance on Heureka and on Zboží.cz? That is common. The price-comparison sites are visited by different users and handle variants differently, so even with the same setting the occupancy of bid positions tends to differ. You will see the difference in the position charts.
-
What does “Outside query” mean? These are products that do not fall into any query used in strategies. Keep an eye on them so that you do not leave a forgotten cost per click in the price-comparison site administration.
-
How often are the figures updated? Statistics are available one day back, positions in bidding are updated continuously.