
📊 Reports#
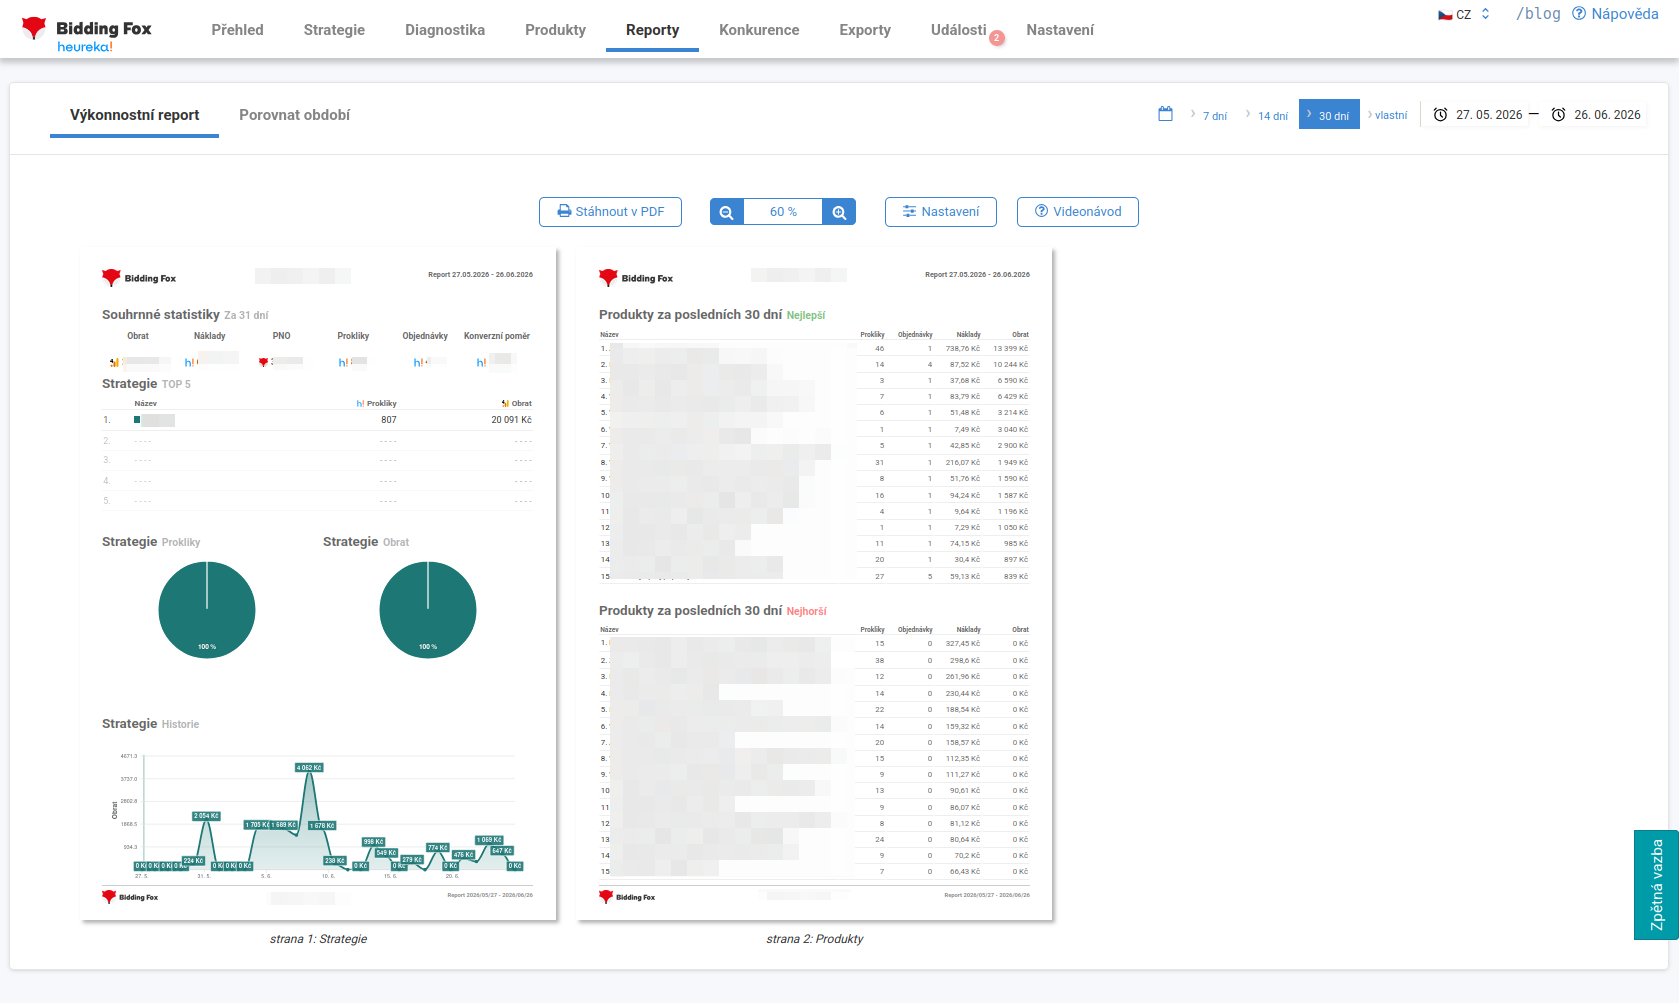
Reports give you an overview of the performance of your strategies and products. They come in handy for you as well as for regular sending to clients. At the top you switch between the Performance report and Compare periods tabs and choose the time range (7 days, 14 days, 30 days or a custom period). The report can be downloaded as a PDF, zoomed in, and there is also a video tutorial for it.
What the report contains#
-
Summary statistics for the chosen period: revenue, costs, PNO (cost/revenue ratio), clicks, orders and conversion rate.
-
TOP 5 strategies: the best-performing strategies by clicks and revenue, complemented by pie charts and a history chart.
-
Best products over the last 30 days (by revenue).
-
Worst products over the last 30 days: products that get clicks but have no orders, so they are only costly. These are worth focusing on.
Regular sending#
You can have the report sent to your email regularly. You set the frequency and see when the next one arrives. Several reports can be sent to several addresses (you, colleagues, a contact at the online store). Sending, as well as a custom logo in the header, is set in Settings in the Report settings section.
Reports are available as PDF (standard and comparison) and can also be downloaded in CSV, XLSX or HTML format.
💡 You can upload your own logo into the report header. Instead of the Bidding Fox logo, the report will then show yours or your client’s logo.
FAQ#
-
Where do I set report sending and a custom logo? In Settings in the “Report settings” section. There you turn on regular sending and upload a logo into the header.
-
In which formats are reports available? As PDF (standard and comparison).
-
What do “worst products” mean? Products that get clicks but have no orders, so they are only costly. They are worth focusing on.
-
What is the “Compare periods” tab for? It lets you compare performance across two time periods side by side.
-
Why does the revenue for TOP and FLOP products not match what I see elsewhere, for example on the Products page? For comparison in reports, revenue is taken from the same source as costs.